

When footy fever hits Term 2, you don't fight it. You harness it.
If you're an Australian teacher in Year 5 or 6, you know the battle well. Getting students to focus on persuasive writing or data analysis when Zak Butters is performing miracles on the oval feels nearly impossible. But here's the thing: this AFL lesson plan doesn't avoid the distraction, it weaponises it.
I've turned this real-world obsession into a structured, curriculum-aligned cross-curricular unit that ticks multiple Australian Curriculum Version 9 (AC9) outcomes in both Mathematics and English. Better yet? Your students won't realise they're learning because they're too busy crunching AFL stats and writing like sports commentators.
Here's exactly how I did it, plus how to adapt it for your classroom.
The Core Idea: "AFL Match Day Analysis"
Students step into the role of sports data analysts. They collect and analyse real AFL/AFLW statistics, create visual representations, and write match reports, player profiles, or persuasive commentary based on their findings. The maths and English naturally feed each other; data informs writing, writing demonstrates mathematical thinking.
It's structured. It covers genuine AC9 outcomes. And it feels like fun, not a lesson.
Quick Links to Resources:
Part 1: The Maths Lesson: "Turn Chaos Into Data"
AC9 Outcomes Covered:
- Data collection, organisation, and representation
- Measurement and conversion
- Probability and prediction
- Financial numeracy
What You'll Need:
- Whiteboard or interactive display
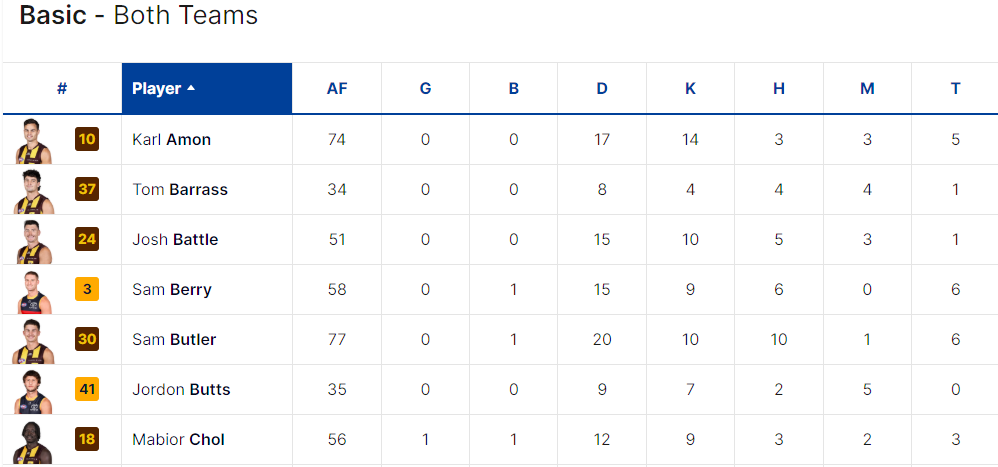
- AFL player stat cards (real stats from AFL.com.au, you could have these on your board or printed)
- Graph paper or digital devices (Sheets, Canva, Excel)
- Calculators (physical or digital)
- Optional: toy footballs for engagement
Step-by-Step Activities
Activity 1: Player Stat Tracking
Hand out random AFL or AFLW player stat cards containing key performance metrics: disposals, goals, tackles, marks, metres gained. For Year 5-6, focus on 4-5 key metrics to avoid cognitive overload.
Ask students: "If you were building a team based on these stats, who'd you pick first?" This hooks engagement immediately while introducing them to data literacy.
Extension: Have students compare male and female player stats across equivalent positions, sparking conversations about gender representation in sport and data equity.
Activity 2: Graph It
Students choose their preferred data representation (bar graphs, pie charts, or line graphs) to display a single player's season progression. Some will go digital; others prefer paper. Both are valid.
Why this works for AC9: Students demonstrate understanding of how different graph types suit different data purposes. They're reasoning about representation, not just creating charts.
Push further by asking: "Which graph best shows if this player is improving? Why?"
Activity 3: Kick-to-Handball Ratio & Game Strategy
Using real AFL player data, students analyse the balance between kicks and handballs to understand playing style and strategy. This naturally introduces ratios, percentages, and data interpretation.
What students calculate:
- Individual player kick-to-handball ratios (e.g., 60% kicks, 40% handballs)
- How ratios differ by position (forwards vs. midfielders vs. defenders)
- Percentage calculations across a full season
- Team strategy comparison (which teams favour kicking vs. handballing?)
Real example:
If Player A has 25 disposals per game and 15 of those are kicks, what's their kick ratio? (15 ÷ 25 = 0.6 or 60% kicks, 40% handballs).
Now compare: Player B has 28 disposals with only 10 kicks. What's their ratio? (10 ÷ 28 = 0.36 or 36% kicks, 64% handballs).
Discussion point: Why might a midfielder have a higher handball ratio than a full-forward? What does this tell us about how they play?
Extension challenge:
Using a full season of data, students calculate: If Player A maintains 60% kicks across 22 rounds with an average of 25 disposals per game, how many total kicks will they have? (25 disposals × 22 rounds × 0.60 = 330 kicks). How does this compare to their actual season total?
This teaches percentage-based reasoning, ratio understanding, and real-world data analysis, all aligned to AC9 numeracy outcomes.
Activity 4: Fantasy Draft Budgeting
Give each student $1 million (imaginary) to build their dream team. Each player has a "salary cap value" based on their stats. This is where percentages and decimals shine naturally.
Example: A premium midfielder costs $250,000; a developing player costs $75,000. Students must balance star players with emerging talent, working through:
- Decimals and place value
- Percentage-based calculations
- Budget constraints and problem-solving
Activity 5: Probability Play (Optional Challenge)
Using historical match data, students calculate probabilities:
- Probability of scoring a goal vs. a behind based on inside-50 entries
- Likelihood of a player scoring 3+ goals based on season averages
- Win probability based on team ladder position
This naturally introduces statistical reasoning aligned to AC9 probability content.
Part 2: The English Lesson: "Write Like You're On Fox Footy"
AC9 Outcomes Covered:
- Creating written and multimodal texts for particular purposes and audiences
- Using paragraphs to organise, develop, and link ideas
- Incorporating topic-specific vocabulary and literary devices
- Explaining and persuading using supporting evidence
What You'll Need:
- Student maths work from Part 1
- Sample AFL/AFLW match reports or commentary scripts (readily available online)
- Templates for match reports, player profiles, and persuasive pieces (optional)
- Recording device for podcast option
Step-by-Step Writing Activities
Activity 1: Match Reports
Using the stats they analysed in Maths, students write news-style match recaps. Provide a simple framework:
- Opening sentence: Who played, final score, standout moment
- Key moments: 2-3 paragraphs with specific stats
- Star player highlight: Who was influential? Why?
- Closing: Looking ahead / impact on ladder position
Example opening: "The Brisbane Lions dominated the Cats on Friday night, winning 14.9 (93) to 11.7 (73) with Ally Rayner's four-goal haul proving the difference."
For differentiation, provide sentence starters for Year 5 students; Year 6 can dive straight in.
Activity 2: Player Profiles (Persuasive)
Students select an AFL or AFLW player and write a persuasive bio arguing why they should make the All-Australian team.
Structure:
- Paragraph 1: Introduce the player and what you are trying to prove about them.
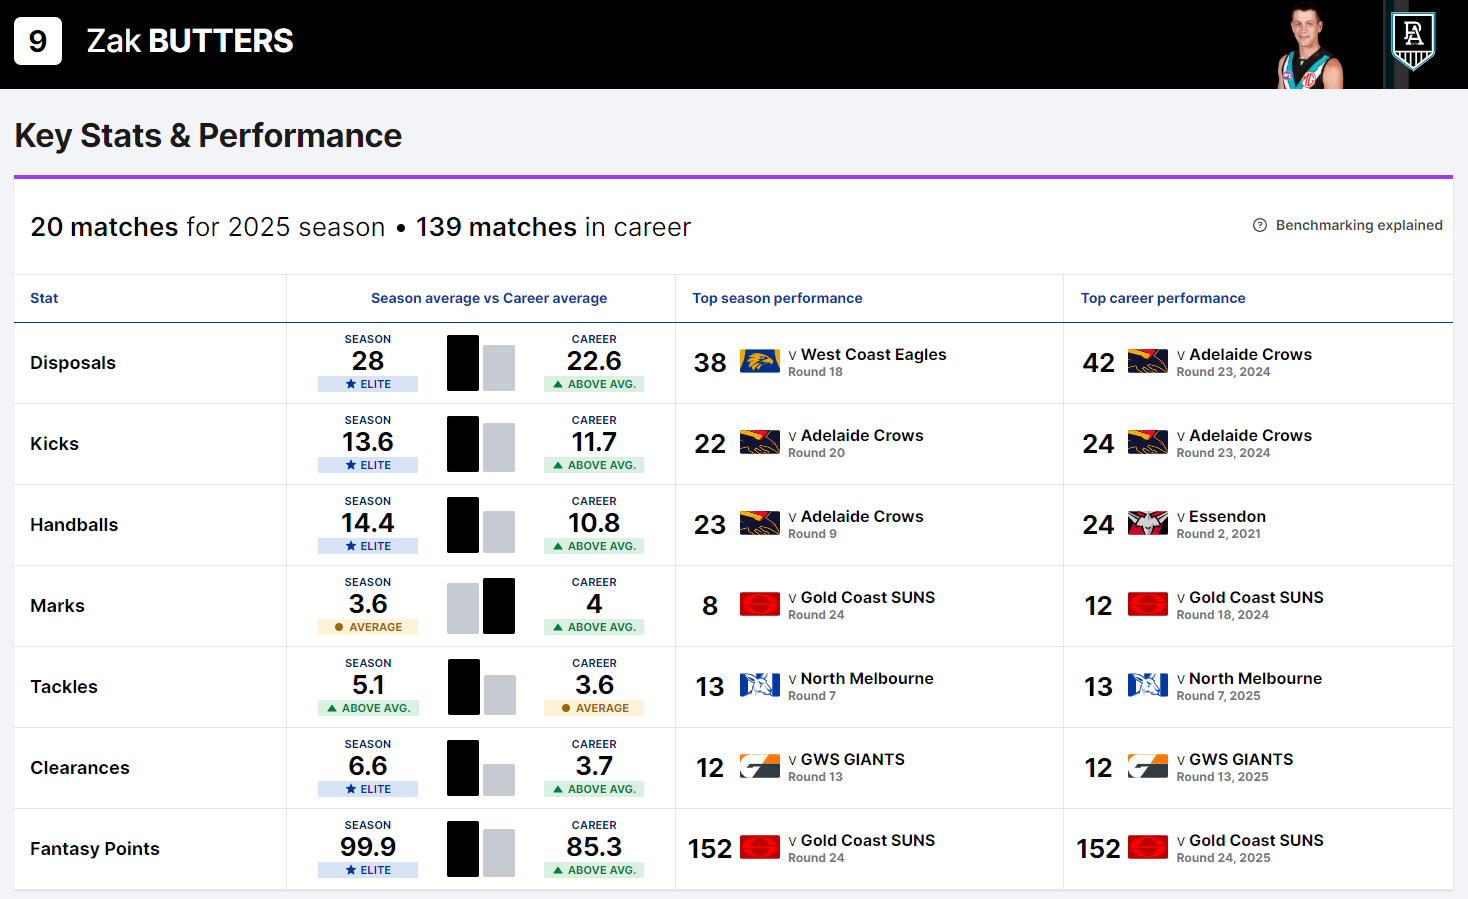
- Paragraph 2: Stat-based evidence (e.g., "With 22 disposals per game and 45 marks this season...")
- Paragraph 3: Additional reasons (e.g., leadership, game-sense, consistency)
- Paragraph 4: Counter any obvious criticism, then reinforce your case
This naturally embeds the AC9 writing outcome: creating texts for particular purposes and audiences, developing and expanding on ideas with supporting details.
Activity 3: Debate & Commentary Scripts
Pose a genuine debate: "Should [player name] make the All-Australian team?" or "Which team will win next week's final?"
Students write persuasive commentary scripts as if they're speaking on SEN or Fox Footy. Provide a sample script first (3-4 sentences is enough for Year 5-6).
Why this works: Persuasive writing becomes real-world authentic; students aren't writing for a mark; they're building an argument to convince listeners.
Activity 4: Podcast Option
Have students record their commentary scripts or match reports as audio. Instant speaking and listening content aligned to AC9's oral language outcomes. Plus, the novelty keeps students engaged, and reluctant writers often shine when given an alternative medium.
Why This AFL Lesson Plan Works (And Why It Saved My Sanity)
1. It leverages existing engagement.
Your students are already thinking about footy. This lesson doesn't fight that; it channels it productively. Motivation is the battle half won.
2. It's genuinely cross-curricular.
Maths and English aren't forced together, they're interdependent. Data informs writing; writing demonstrates mathematical understanding. Students see the connection naturally.
3. It covers substantial AC9 outcomes.
You're not filling time with activities. This unit addresses core content in both learning areas while building critical thinking, communication, and numeracy proficiency.
4. It accommodates diverse learners.
Visual learners graph data. Kinesthetic learners benefit from the "Stat Battle" competition. Strong writers can tackle persuasive pieces; reluctant writers use the maths as a scaffold. Podcast option captures auditory and alternative learners.
5. It requires minimal prep.
Most AFL/AFLW statistics are freely available online at AFL.com.au and AFLW stats pages. You don't need to create custom worksheets (though I've got downloadable stat trackers available for newsletter subscribers, see below).
Easy Variations & Extensions
Gender Balance
Deliberately incorporate AFLW statistics and player profiles alongside AFL data. This provides equal representation and sparks valuable conversations about women in sport.
Local Context
If your school or community plays footy, collect match data from your own games. Buy-in skyrockets when students analyse their own performance.
Compare Eras
Have students research stats from AFL legends (e.g., Ablett Sr. vs. Ablett Jr., Dusty's peak years). This introduces historical analysis and research skills.
Multi-Sport Adaptation
This framework works beautifully with other sports:
- NBL / NBA basketball: Three-point percentages, assist-to-turnover ratios
- NRL rugby league: Try-scoring patterns, defensive statistics
- Netball: Shooting accuracy, footwork penalties
- A-League football: Goal conversion, possession statistics
The underlying structure: collect data, analyse, write. There is an opportunity for this lesson structure transfers across sports perfectly.
Implementation Tips for Success
Start Small: If this is new territory, run Part 1 (Maths) as a standalone 2-3 lesson unit first. Add English writing once students are comfortable with the data.
Scaffold Generously: Provide sentence starters, graph templates, and sample texts. Remove scaffolding gradually as student confidence builds.
Make It Visible: Display student graphs and writing around the classroom. Celebrate effort publicly. This boosts engagement and gives reluctant learners a reason to participate.
Connect to Your School's Focus: If your school emphasises data literacy, wellness, or literacy, position this lesson as demonstrating those priorities. It strengthens your planning documentation.
Access the Free Resource Hub:
- TES Australia has 565,000+ free resources, many aligned to AC9
- AFL Schools Membership offers free lesson plans, professional learning, and curriculum support
- Australian Sports Commission Lesson Ideas includes 30+ AFL-themed lesson ideas across key learning areas
Your Turn: Get the Free Stats Worksheet
Want a done-for-you AFL player stat tracker for your students? Subscribers to the EduHacking newsletter get instant access to a printable and digital version featuring real 2025 AFL and AFLW data, perfect for Year 5-6.
